
At the end of last year, I gave a workshop at ComSciCom RWM 2021, and an attendee said, “I usually think if [my visual] is pretty, people will look at it longer and eventually understand it”.
I used to think the same thing, but about writing. If I used big fancy words to convey my ideas, the reader would think I was smart and made an effort to understand the depth of my thought process. Anyone who has marked undergraduate assignments knows how well this goes down (not well)!
Just because something is fancy, pretty, or eye-catching doesn’t always mean it fits its purpose.
Let’s take abstracts in journal articles, for example. Whether an abstract is written or graphical, it still needs to capture the main points of the study clearly and concisely. It needs to distil complex information and communicate it quickly. An eye-catching image for a graphical abstract that doesn’t say much is like a well-written abstract that omits the key outcomes of the study – it has failed in its purpose.
Design with purpose
Designing a visual involves design, and design is fundamentally about solving specific problems. Something that is well designed has a purpose and is useful in that purpose.
We use visual principles to communicate a message, feeling, or identity in graphic design or visual communication. In science communication, visual language is used to distil complex ideas into plots, figures, diagrams, and graphics that help facilitate understanding.
Here’s the thing, the visual you create needs to contribute meaningfully to the story you are trying to tell. If the visual is pretty but as complicated as the text, data, or concept it is trying to convey, then it fails to do its job. It is only one step above ugly and complicated.
Let’s look at an example using parking signs.
Bear with me here because parking signs are an excellent example of what we are talking about. First, they represent a situation where complex information needs to be quickly and easily communicated and comprehended (sound familiar?). Second, they are a great example of where thought has gone into using visual tools (i.e., making it visually appealing), but this doesn’t enhance the object’s functionality.
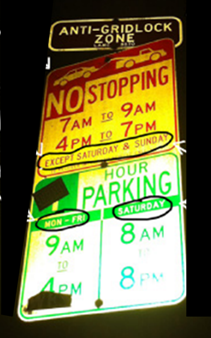
Look at this sign, for example. It has some basic graphic design elements. The no-stopping times are red and when parking is allowed is green – two classic colours in western society that represent ‘no-go’ and ‘good-to-go’, respectively. Gold star there. The text is pretty easy to read, too; the font is clear, and the critical information (the times) is large, although in this case, the days are harder to read. There is also a tow-truck icon to highlight the consequences of parking during the no stopping times.
Despite this, the information is still tough to interpret and comprehend.
This is best understood with a demonstration. I want you to pull up a stopwatch on your phone. Seriously go ahead and do it before you read on.
With your stopwatch, I want you to time how long it takes you to figure out whether you can park next to this sign, based on the time and date you are reading this post.
I’ll wait…
…
…
…
What did you get?
When I do this activity in my workshops, it usually takes between 20-40 seconds, sometimes over a minute, for people to figure out if they can park. That’s a long time when you are holding up traffic. I’ve also had people just give up, or get it wrong.
At least once in my life, I have gotten a parking fine because I interpreted a parking sign wrong. I am not the only one; Nikki Sylianteng also had this problem. After getting another expensive fine in LA, when she was sure she wasn’t parking illegally, Nikki went home and tried to figure out what the sign was saying.
This is what she drew:
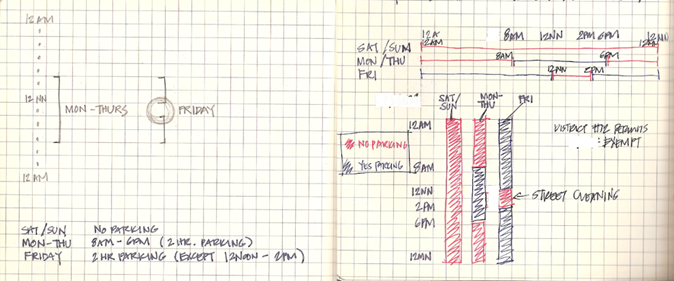
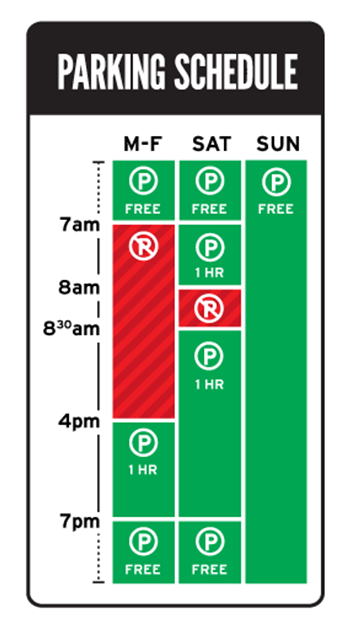
From this, she launched an attack on the parking signs of the world. She completely redesigned how the information on parking signs is visualised:
Now time yourself figuring out if you can park again.
What did you get this time? Much quicker, hey?
The difference is that, with Nikki’s design, we can quickly and easily comprehend the information and what it means for us. Nikki still uses colours, icons and has the times and days written out, but by laying it out like a calendar, she has visually represented the information in a way that lets us quickly scan to the window of time we are currently in and see whether parking is allowed.
The new parking signs are sexy and are well-designed – they facilitate the understanding of complex information.

Make thinking easier
I think part of the reason Nikki’s parking signs are so effective is that they reduce cognitive load. I will point out that I am not an expert here. If you are, feel free to share your thoughts.
From what I understand, our brains can only handle a few chunks of information (four to seven) in our working memory at one point in time. More than this, and we get overloaded. For long-term memory, we store learned information as ‘schemas’ or frameworks that organise related ideas together. We draw on these schemas to help us make sense of what is sitting in our short-term memory. The closer the information in our working memory is to a well-developed schema, the easier the thinking process is.
This is why we are taught basic arithmetic before complex algebra. We need to establish the addition, subtraction, multiplication, and division schemas in our long-term memory before we can go on and solve complex algebraic equations. I.e., We need to learn what ‘2/3’ means before thinking about solving 2a + b = 3c.
The wonderful thing about good visual design is that it can easily tap into established schemas. This reduces the need to juggle multiple new ideas in our working memory.
Back to Nikki’s parking signs. Most of us are used to using calendars; I’m sure we were taught how to interpret them at some point. If a calendar has the days along the top (columns) and the times down the side (rows), we know that an entry in column ‘Friday’, row ‘2 pm’, is for Friday 2 pm. Likewise, we could find out if we are free on Monday at 8 am by going to column ‘Monday’, row ‘8 am’. We don’t have to re-learn this every time we check our calendars because we have a ‘calendar’ schema established in our long-term memory.
By tapping into our ‘calendar’ schemas, Nikki’s parking signs only ask us to hold the current date and time in our working memory and then apply them to the calendar schema presented on the sign. In contrast, the old parking signs ask us to interpret the information on the sign (i.e., make our own abstract calendar in our minds), while simultaneously holding the current date and time, and applying it to that framework. All in our limited working memory. Talk about cognitive overload, oof!

Design for science
Like most scientists, I am under a lot of pressure to juggle many things at once (so thank you for taking time out to read this). Part of our job is keeping an eye on new development in our fields and thinking about how it relates to our work. Reading papers and listening to talks demands a lot of working-memory space: we are trying to hold multiple new ideas while simultaneously linking them to what we already know. Good communication – in this context, well-designed visuals – reduces cognitive load so that the audience can quickly move from perceiving the information to interpreting and comprehending it. In short, they allow us to get on with research without overloading our brains (too much).
The full version of the quote at the start of this article is: “I should try to decrease the cognitive load of my designs. I usually think if it is pretty, people will look at it longer and eventually understand that, but now looking at other science designs, I see that is not the case.”
I plan to talk more about how to move away from just being pretty and towards being purposeful. For now, the next time you look at a figure, graphical abstract, or visuals in a presentation, I want you to ask yourself whether the author is making your brain do more or less work. Start noticing what schemas they might be drawing on (or could draw on) to help reduce cognitive load.
In this post about visual hierarchy, I discuss some ways you can use the aesthetics of your graphic to reduce the effort required to navigate your graphic.
I want this to be useful and interesting for you! If you have a question about creating visuals for science, or a concept you would like to learn more about, reach out on Twitter by tagging me @KnowlegibleDsg. If I don’t know the answer, we’ll figure it out together.
Want to know when a new post comes out? Join the mailing list here.
Don’t forget to share this with others who would find this helpful!
Thanks for being here,